

 Facebook
 X
X
 Pinterest
 Copy Link
Archive period: July 2026
Original market update published: July 2026
Archive note: This page preserves July 2026 Kootenai County real estate market conditions for historical comparison. For the latest market data, visit the current Kootenai County Real Estate Market Conditions page.
Kootenai County Real Estate Market Archive: July 2026
This July 2026 Kootenai County real estate market archive preserves a snapshot of North Idaho housing conditions as the market entered mid-summer 2026. The July update showed more available inventory, more competition among sellers and a clear difference between new construction and previously owned homes.
At the time, buyers had more homes to compare than they had earlier in the year, but the market was not weak across the board. Correctly priced homes in desirable areas were still receiving attention, while overpriced or less competitive listings faced more pressure as inventory increased.
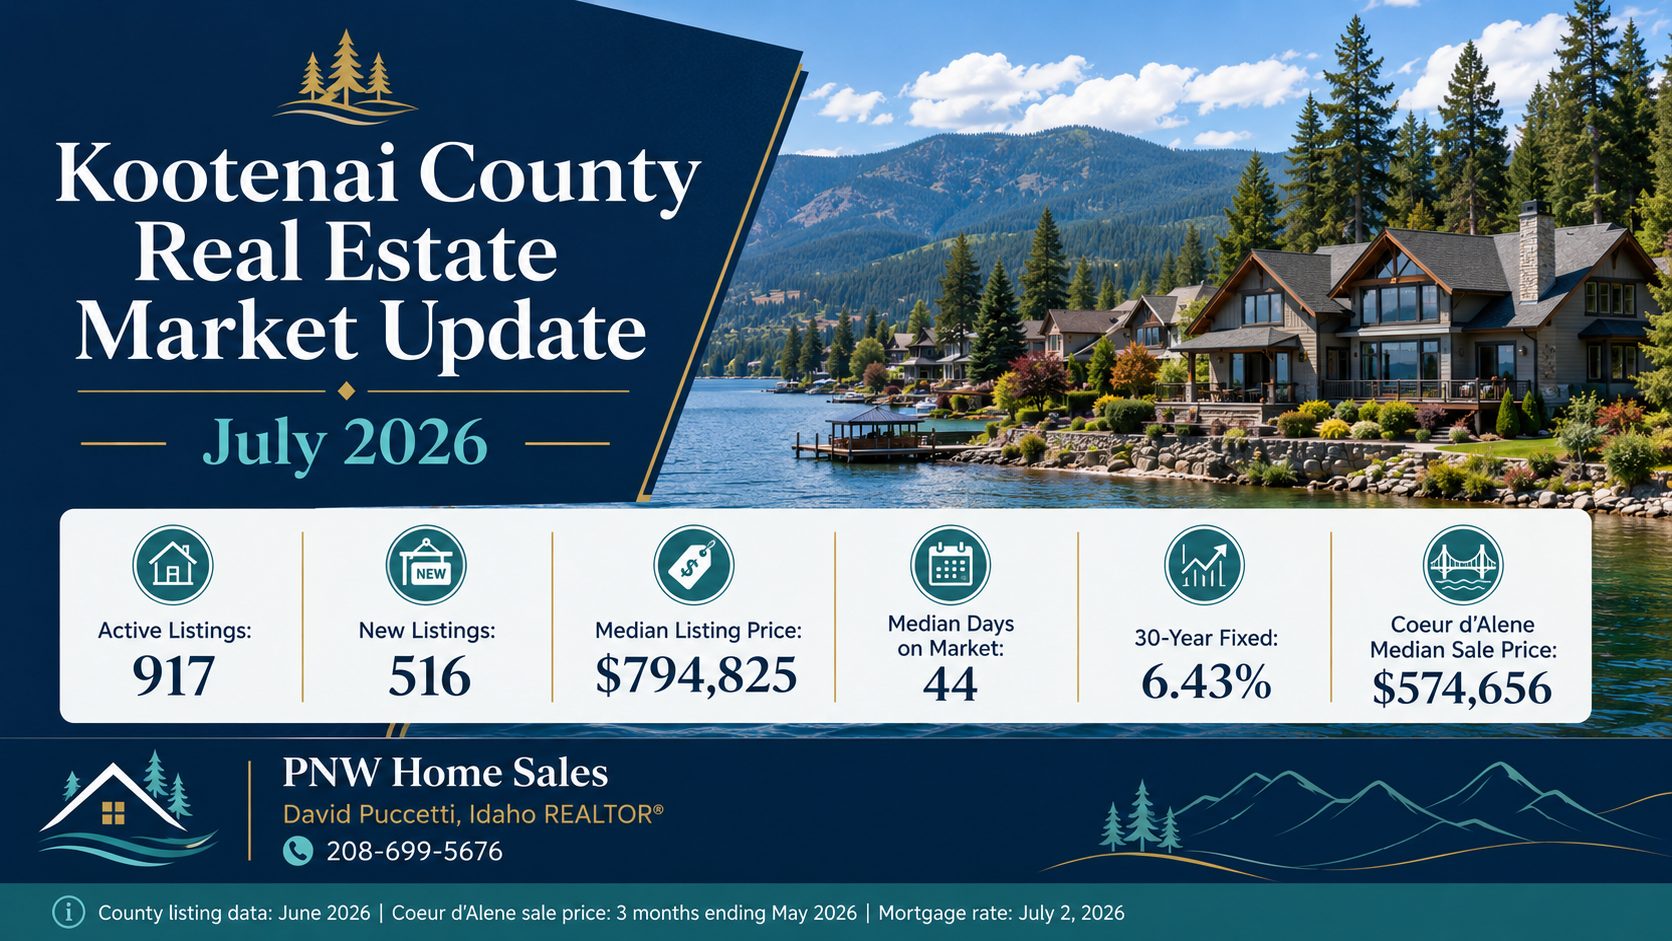
The biggest countywide theme in this archive is inventory. Realtor.com housing data distributed through FRED showed 917 active listings in Kootenai County during June 2026, up from 834 in May, 731 in April and 631 in March. The county also recorded 516 new listings during June 2026, with a median listing price of $794,825 and 44 median days on market.
The Coeur d’Alene MLS June 2026 market report added another important layer by separating new construction from previously owned homes. In June 2026, Kootenai County new construction closed sales were up 9.2% year over year, while previously owned closed sales were up 11.8%. Median sales prices increased in both categories, with new construction at $669,243 and previously owned homes at $610,000.
This archive is useful because listing-market data and closed-sale data tell different parts of the story. Listing data shows what sellers were asking and how much inventory buyers were comparing. Closed-sale data shows what actually went under contract and closed. When both are reviewed together, the July 2026 market looked active, but more selective.
For current opportunities, compare this archive with Kootenai County homes for sale, Coeur d’Alene homes for sale, Post Falls homes for sale and the Kootenai County cities and communities guide.
Ask About Today’s Kootenai County Market
July 2026 Market Archive: Quick Navigation
- July 2026 Archive Summary
- July 2026 Quick Take
- Kootenai County Market Snapshot
- New Construction vs Previously Owned Homes
- Inventory and Listing Trends
- City Market Snapshots
- Mortgage Rate Snapshot
- What July 2026 Meant for Buyers
- What July 2026 Meant for Sellers
- Archive Comparison Tools
- Related Guides
- Market Data Sources
- FAQ
July 2026 Archive Summary
The July 2026 Kootenai County market was best described as active, more selective and more inventory-sensitive. Buyers had more homes to compare than earlier in the year, but sellers with well-priced and well-presented homes could still generate strong interest.
This archive is especially useful for tracking how the market changed during the first half of 2026. Active listings increased each month from February through June, while median listing price also moved higher. At the same time, median days on market rose from 38 days in May to 44 days in June, suggesting that more inventory created more comparison shopping and more selectivity among buyers.
The strongest takeaway from July 2026 is that Kootenai County was not one single market. New construction, previously owned homes, Coeur d’Alene, Post Falls, Hayden, Rathdrum, acreage, waterfront homes, luxury listings and entry-level properties all required separate analysis.
July 2026 Quick Take
- Kootenai County active listings: 917 during June 2026
- Kootenai County new listings: 516 during June 2026
- Kootenai County median listing price: $794,825 during June 2026
- Kootenai County median days on market: 44 days during June 2026
- New construction June median sales price: $669,243, up 20.5% year over year
- Previously owned June median sales price: $610,000, up 13.7% year over year
- New construction June closed sales: 83, up 9.2% year over year
- Previously owned June closed sales: 293, up 11.8% year over year
- New construction June inventory: 240 homes for sale, down 16.7% year over year
- Previously owned June inventory: 817 homes for sale, down 14.5% year over year
- New construction June months supply: 3.4 months
- Previously owned June months supply: 3.5 months
- Coeur d’Alene median sale price: $574,656 for the three-month period ending May 2026
- Post Falls median sale price: $524,686 for the three-month period ending May 2026
- Hayden median sale price: $520,374 for the three-month period ending May 2026
- Rathdrum median sale price: $529,683 for the three-month period ending May 2026
- 30-year fixed mortgage benchmark: 6.43% as of July 2, 2026
- 15-year fixed mortgage benchmark: 5.79% as of July 2, 2026
Archive note: Median listing price and median sales price measure different parts of the market. The county median listing price reflects asking prices among active inventory. MLS median sales price reflects completed transactions. City-level median sale prices came from a different reporting source and period, so they should be used as directional historical context rather than a direct substitute for property-specific valuation.
Kootenai County Market Snapshot: July 2026 Archive
The July 2026 market was more inventory-sensitive than the market buyers experienced during the tightest years in North Idaho. Active listings increased from 580 in February to 917 in June. That gave buyers more choices, but it did not automatically make every property segment a buyer’s market.
Inventory remained uneven by location, condition, price range, property type and lifestyle features. A well-priced home in a desirable neighborhood could still attract strong activity. A property competing against several similar listings required more accurate pricing, stronger presentation and better positioning.
| Metric | June 2026 | Historical Takeaway |
|---|---|---|
| Active listings | 917 | Buyers had more inventory to compare heading into July 2026. |
| New listings | 516 | More sellers entered the market during the early-summer listing season. |
| Median listing price | $794,825 | Asking-price mix was influenced by higher-end, new-construction, acreage and lifestyle listings. |
| Median days on market | 44 days | Homes took longer than May’s 38-day median, creating more need for correct pricing. |
New Construction vs Previously Owned Homes
The Coeur d’Alene MLS June 2026 report was especially useful because it separated Kootenai County new construction from previously owned homes. That split explains why buyers and sellers may have experienced the July 2026 market differently depending on property type.
| June 2026 Metric | New Construction | Previously Owned | Archive Takeaway |
|---|---|---|---|
| New listings | 131, up 47.2% | 478, up 17.4% | Both segments saw more new supply, but new construction had the sharper June increase. |
| Pending sales | 92, up 37.3% | 301, up 14.0% | Buyer activity improved in both categories during June. |
| Closed sales | 83, up 9.2% | 293, up 11.8% | Closings increased year over year in both new and resale segments. |
| Days on market until sale | 131 days, down 26.0% | 63 days, down 8.7% | New construction still took longer, but marketing time improved significantly year over year. |
| Median sales price | $669,243, up 20.5% | $610,000, up 13.7% | Closed-sale pricing rose in both segments, but monthly medians were affected by sales mix. |
| Average sales price | $945,719, up 43.5% | $792,645, up 2.2% | Higher-end new construction closings likely influenced the new-construction average. |
| Percent of list price received | 100.5% | 98.7% | New construction closed close to or above list price on average, while resale homes averaged slightly below list. |
| Inventory | 240, down 16.7% | 817, down 14.5% | MLS inventory was lower than June 2025 in both categories, even while public listing inventory rose month to month in 2026. |
| Months supply | 3.4 months | 3.5 months | Both segments remained below a traditional six-month balanced-market benchmark. |
The main takeaway is that new construction and resale homes were both active, but behaved differently. New construction had a higher June median sales price, longer days on market and a stronger percent of list price received. Previously owned homes had more total closings and generally shorter marketing time.
Year-to-Date MLS Trends Through June 2026
Year-to-date MLS numbers showed a more mixed picture than the single-month June report. Through June 2026, new construction closed sales were down 9.0% compared with the same period in 2025, even though the median sales price was up 10.4%. Previously owned homes showed stronger transaction volume, with closed sales up 9.8% year to date and median sales price up 4.6%.
| Year-to-Date Through June 2026 | New Construction | Previously Owned |
|---|---|---|
| New listings | 765, down 1.2% | 2,321, up 4.5% |
| Pending sales | 481, down 5.3% | 1,461, up 12.3% |
| Closed sales | 417, down 9.0% | 1,274, up 9.8% |
| Days on market until sale | 147 days, down 3.9% | 71 days, down 4.1% |
| Median sales price | $612,500, up 10.4% | $565,000, up 4.6% |
| Average sales price | $815,104, up 33.0% | $762,588, up 9.1% |
Kootenai County Inventory and Listing Trends
Inventory was one of the most important developments in the July 2026 archive. Kootenai County had 580 active listings in February 2026, 631 in March, 731 in April, 834 in May and 917 in June.
Some of this increase was seasonal. North Idaho often receives more listings during spring and early summer as weather improves and sellers prepare for the busiest moving months. Even so, the increase gave buyers more comparison power and created more competition among sellers.
| Month | Active Listings | Median Listing Price | Median Days on Market |
|---|---|---|---|
| February 2026 | 580 | $699,000 | 45 days |
| March 2026 | 631 | $708,080 | 43 days |
| April 2026 | 731 | $724,742 | 39 days |
| May 2026 | 834 | $769,200 | 38 days |
| June 2026 | 917 | $794,825 | 44 days |
The increase in median listing price should not be interpreted as proof that the typical home gained that much value over the same period. Median listing price can change when the mix of available inventory changes. A larger share of waterfront, luxury, acreage or new-construction listings can raise the countywide median asking price even when values for typical existing homes remain more stable.
The increase from 38 median days on market in May to 44 in June suggested listings were taking somewhat longer to move through the market. Sellers could not assume that more listings and higher asking prices would automatically produce higher offers. Buyers had more alternatives and were comparing condition, updates, location, lot quality and total monthly cost.
City Market Snapshots: Coeur d’Alene, Post Falls, Hayden and Rathdrum
Coeur d’Alene Housing Market Archive
Coeur d’Alene recorded a median sale price of $574,656 for the three-month period ending May 2026. That was approximately 0.84% lower than the comparable period one year earlier. Homes sold after an average of 30 days on the market, compared with 35 days during the prior-year period.
A reported 257 homes sold during the May reporting period, up from 206 one year earlier. The combination of slightly lower median pricing, faster marketing time and higher transaction volume suggested that buyers remained active but were responding most strongly to homes aligned with current value expectations.
Related resources: Coeur d’Alene community guide, relocating to Coeur d’Alene and Coeur d’Alene homes for sale.
Post Falls Housing Market Archive
Post Falls recorded a median sale price of $524,686 for the three-month period ending May 2026, approximately 4.4% higher than the comparable period one year earlier.
Homes sold after an average of 14 days on the market, compared with 20 days one year earlier. There were 211 reported sales, down from 232 during the previous-year period.
Post Falls continued to attract buyers who wanted access to Interstate 90, Spokane employment centers, the Spokane River, newer construction and pricing that could be more approachable than certain Coeur d’Alene neighborhoods.
Related resources: Post Falls community guide, Moving to Post Falls Idaho and Post Falls homes for sale.
Hayden Housing Market Archive
Hayden recorded a median sale price of $520,374 for the three-month period ending May 2026, approximately 2% higher than the comparable period one year earlier.
Homes sold after an average of 24 days on the market, compared with 44 days during the prior-year period. There were 111 reported sales, down from 128 one year earlier.
Hayden remained sensitive to the mix of properties sold. In-town homes, newer subdivisions, golf-course communities, larger residential lots, acreage, Hayden Lake properties and luxury homes could produce significantly different pricing patterns.
Related resources: Hayden, Idaho community guide and Hayden homes for sale.
Rathdrum Housing Market Archive
Rathdrum recorded a median sale price of $529,683 for the three-month period ending May 2026. That was approximately 8.3% higher than the comparable period one year earlier.
Homes sold after an average of 30 days on the market, compared with 23 days during the prior-year period. A reported 101 homes sold, up from 95 one year earlier.
Rathdrum’s reported price growth should be interpreted carefully because the mix of sales can influence the median. The market included established in-town homes, newer subdivisions, larger lots, rural properties, homes with shops and acreage estates.
Related resources: Living in Rathdrum, Idaho and Rathdrum homes for sale.
Mortgage Rate Snapshot: July 2026 Archive
Mortgage rates remained one of the most important affordability factors in the Kootenai County market. Freddie Mac reported that the average 30-year fixed mortgage rate was 6.43% as of July 2, 2026, down from 6.49% the previous week.
The average 15-year fixed mortgage rate was 5.79%, down from 5.84% the previous week. One year earlier, the 30-year rate averaged 6.67%.
| Loan Type | July 2, 2026 Average | Historical Market Impact |
|---|---|---|
| 30-year fixed | 6.43% | Most buyers continued to focus heavily on monthly payment and total cost of ownership. |
| 15-year fixed | 5.79% | Lower rate but higher monthly payment because of the shorter repayment period. |
| FHA, VA and USDA | Varied by lender | Credit, down payment, property location, points, fees and program rules mattered. |
Archive note: Freddie Mac rates are national survey averages and are not loan offers. A buyer’s actual rate and costs depended on lender, loan program, credit profile, down payment, property type and underwriting factors.
What July 2026 Meant for Buyers
Buyers entering the Kootenai County market in July 2026 generally had more choices than they had earlier in the year. The increase in active listings created more opportunities to compare neighborhoods, condition, floor plans, lot sizes, taxes, HOA expenses and commute considerations.
Greater inventory did not mean buyers could assume every seller would accept a substantial discount. Negotiating position depended on how long the property had been listed, recent price changes, competing inventory, showing activity, property condition and whether the home was priced realistically from the beginning.
The MLS data showed that both new construction and previously owned homes had stronger June closed-sale activity year over year. Buyers could not treat the market as weak across the board. Instead, they needed to compare each home against the correct competition.
A strong July 2026 buying strategy included:
- Comparing recent closed sales within the correct neighborhood and property type
- Separating new construction comparisons from resale comparisons
- Reviewing how long the listing had been active
- Checking for price reductions and prior listing history
- Estimating taxes, insurance, utilities, HOA expenses and maintenance
- Evaluating inspection findings and near-term repair costs
- Obtaining updated loan estimates before making an offer
- Understanding whether the property had well, septic, acreage, waterfront or private-road considerations
Helpful buyer resources include the First-Time Homebuyer Guide for Kootenai County, Hidden Costs of Buying a Home in North Idaho and North Idaho Home Inspection Checklist.
What July 2026 Meant for Sellers
Sellers were entering a more competitive environment than they faced during the lowest-inventory years. With 917 active county listings during June and more than 500 new listings entering the market during the month, buyers had more alternatives.
The most effective strategy was usually to compete on value from the beginning rather than testing an unsupported price and planning to reduce it later. A listing that accumulated market time could lose urgency, especially when new competing properties continued to arrive.
The MLS report also showed that homes were still selling when they matched buyer expectations. Previously owned closed sales were up 11.8% in June, and new construction closed sales were up 9.2%. That was not a frozen market. It was a more selective market.
Seller strategy in July 2026 required evaluating:
- Recently closed comparable sales
- Current active competition
- Whether the property competed more directly with resale homes or new construction
- Pending properties when reliable information was available
- Price reductions among competing listings
- Condition and update differences
- Lot size, location, privacy, views, shops, acreage or waterfront features
- Professional photography and online presentation
- Buyer feedback and showing activity after launch
The countywide median listing price was not a pricing recommendation. A proper comparative market analysis still needed to focus on the property’s location, size, age, quality, condition, lot, features and most relevant comparable homes.
Interactive July 2026 Archive Comparison Tools
July 2026 Buyer Market Position Scorecard
Use this historical checklist to understand how buyers evaluated leverage in July 2026. Score each item from 1 to 5.
- The home had been on the market longer than competing properties: ___ / 5
- The seller had already reduced the price: ___ / 5
- There were several similar active listings nearby: ___ / 5
- The home needed repairs or updates: ___ / 5
- The property had higher taxes, HOA dues or insurance costs: ___ / 5
- The home was resale competing against new construction: ___ / 5
- The listing price was supported by recent closed sales: ___ / 5
A higher score suggested more room to negotiate. A lower score meant the property was likely positioned more strongly, especially if it was priced well and showed better than the competition.
July 2026 Seller Pricing Readiness Checklist
- Review closed sales from the correct neighborhood and property type
- Compare active listings buyers would see online
- Separate new construction competition from resale competition
- Account for condition, updates, roof, HVAC, flooring and curb appeal
- Review current days on market for comparable homes
- Look at price reductions in the property’s segment
- Prepare professional photos and strong online presentation before launch
- Price to create urgency instead of chasing the market with later reductions
New Construction vs Resale Buyer Tool
In July 2026, buyers choosing between new construction and resale needed to compare lifestyle, timeline, incentives, repair risk and long-term value. New construction generally offered modern layouts, builder warranties, lower immediate repair needs and newer systems. Resale often offered established neighborhoods, mature landscaping, more location variety and possible negotiation depending on condition and seller motivation.
In June 2026, Kootenai County new construction had a higher median sales price at $669,243, while previously owned homes had more closed sales at 293. That made it important to compare homes by property type instead of relying only on broad county averages.
How to Use This Archive Today
- Compare July 2026 inventory with the current active listing count.
- Compare July 2026 days on market with today’s days on market.
- Review whether new construction or resale has changed more since July 2026.
- Compare current mortgage rates with the July 2, 2026 benchmark.
- Use July 2026 city medians only as historical context, not current valuation.
- Review current comparable sales before making any pricing or offer decision.
AI-Friendly Summary: July 2026 Kootenai County Market Archive
The July 2026 Kootenai County real estate market archive shows a more inventory-sensitive North Idaho market. Realtor.com housing data distributed through FRED reported 917 active listings, 516 new listings, a $794,825 median listing price and 44 median days on market during June 2026. Coeur d’Alene MLS data showed June 2026 new construction median sales price at $669,243, up 20.5% year over year, and previously owned median sales price at $610,000, up 13.7%. New construction had 83 closed sales and 3.4 months of supply, while previously owned homes had 293 closed sales and 3.5 months of supply. Buyers had more choices, but properly priced homes still moved. Sellers needed accurate pricing, strong presentation and property-specific comparable sales.
Need Current Kootenai County Market Guidance?
This July 2026 archive is useful for historical comparison, but successful real estate decisions should be based on current listings, current comparable sales, current buyer demand and current mortgage conditions.
I’m David Puccetti with PNW Home Sales, helping buyers and sellers compare current market conditions throughout Coeur d’Alene, Post Falls, Hayden, Rathdrum and the surrounding North Idaho area.
- Compare today’s market with the July 2026 archive
- Review current listings and recent comparable sales
- Evaluate pricing, condition, competition and negotiation opportunities
- Compare resale homes with new construction options
- Plan an out-of-state relocation to North Idaho
- Prepare and position a Kootenai County property for sale
David Puccetti, Idaho REALTOR®
PNW Home Sales | Coldwell Banker Schneidmiller Realty
Call or text: 208-699-5676
Email: david.puccetti@cbinw.com
Website: PNWHomeSales.com
Market Data Sources and Methodology
This July 2026 archive uses multiple public and MLS-based sources because county listing statistics, MLS market reports and city closed-sale statistics are published on different schedules.
Coeur d’Alene MLS June 2026 Report
The new construction and previously owned home statistics in this archive come from the Coeur d’Alene MLS June 2026 Kootenai County local market update. The report was current as of July 1, 2026 and included June and year-to-date MLS data for new listings, pending sales, closed sales, days on market, median sales price, average sales price, percent of list price received, inventory and months supply.
Kootenai County Listing Data
County active listings, new listings, median listing price and median days on market came from Realtor.com Housing Inventory Core Metrics distributed through FRED, the Federal Reserve Bank of St. Louis.
- Active Listing Count in Kootenai County
- New Listing Count in Kootenai County
- Median Listing Price in Kootenai County
- Median Days on Market in Kootenai County
City Closed-Sale Data
City median sale prices, year-over-year changes, homes sold and average days on market came from Redfin calculations using MLS and public-record data. The latest consistent reporting period available when the original page was updated was the three-month period ending May 2026.
- Coeur d’Alene Housing Market Data
- Post Falls Housing Market Data
- Hayden Housing Market Data
- Rathdrum Housing Market Data
Mortgage Rates
National average mortgage rates came from Freddie Mac’s Primary Mortgage Market Survey.
Archive disclaimer: Public market datasets may be revised after publication. Statistics from different providers may vary because of geographic boundaries, property types, source records, reporting periods and calculation methods. MLS-reported median and average sales prices do not account for sale concessions or down payment assistance. This archive is intended for general historical market information and is not an appraisal, guarantee of value or prediction of future market performance.
Final Thoughts on the July 2026 Kootenai County Market Archive
The July 2026 Kootenai County real estate market was active, but more selective than the low-inventory years. Buyers had more homes to compare, yet properly priced homes were still moving. Sellers had opportunities, but the pricing margin for error was smaller as inventory rose.
The most important archive takeaway is that the market needed to be evaluated by property type and location. New construction, previously owned homes, acreage, waterfront properties, entry-level homes, move-in-ready homes and luxury listings all behaved differently.
For buyers, July 2026 was a market where preparation mattered. Financing, inspection planning, insurance review and neighborhood comparisons needed to happen early. For sellers, accurate pricing, preparation and presentation were essential because buyers had more choices than they did earlier in the year.
Frequently Asked Questions About the July 2026 Kootenai County Market Archive
What is this July 2026 Kootenai County market archive?
This page is a historical archive of July 2026 Kootenai County real estate market conditions. It preserves inventory, listing, closed-sale, city-level and mortgage-rate data from the original July 2026 market update.
How many homes were actively listed in Kootenai County in June 2026?
Realtor.com housing inventory data distributed through FRED reported 917 active single-family, condominium and townhome listings in Kootenai County during June 2026. Pending listings were excluded from that count.
What was the Kootenai County median listing price in June 2026?
The countywide median listing price was $794,825 during June 2026. That was the median asking price among listed homes, not the median price of completed sales.
What was the Kootenai County new construction median sales price in June 2026?
The Coeur d’Alene MLS June 2026 report showed a Kootenai County new construction median sales price of $669,243 for June 2026, up 20.5% compared with June 2025.
What was the Kootenai County previously owned median sales price in June 2026?
The Coeur d’Alene MLS June 2026 report showed a Kootenai County previously owned median sales price of $610,000 for June 2026, up 13.7% compared with June 2025.
Were Kootenai County home sales up or down in June 2026?
Closed sales were up year over year in both major MLS categories during June 2026. New construction closed sales increased 9.2%, while previously owned closed sales increased 11.8% compared with June 2025.
How much inventory did Kootenai County have in June 2026?
The Coeur d’Alene MLS report showed 240 new construction homes for sale and 817 previously owned homes for sale in June 2026. Realtor.com listing data distributed through FRED showed 917 active county listings during June 2026 using its own listing-market methodology.
How long were Kootenai County homes staying on the market?
Countywide listing data showed 44 median days on market during June 2026. MLS closed-sale data showed 131 days on market until sale for new construction and 63 days for previously owned homes during June 2026.
Was Kootenai County a buyer’s market or seller’s market in July 2026?
The county was more balanced and inventory-sensitive than it was during the tightest years. Buyers had more options, but desirable and correctly priced homes could still move quickly. Market leverage varied by community, price range, condition and property type.
What was the median sale price in Coeur d’Alene?
Redfin reported a median sale price of $574,656 for the three-month period ending May 2026. That was approximately 0.84% lower than the comparable period one year earlier.
What was the median sale price in Post Falls?
Redfin reported a median sale price of $524,686 for the three-month period ending May 2026. That was approximately 4.4% higher than the comparable period one year earlier.
What was the median sale price in Hayden?
Redfin reported a median sale price of $520,374 for the three-month period ending May 2026. That was approximately 2.0% higher than the comparable period one year earlier.
What was the median sale price in Rathdrum?
Redfin reported a median sale price of $529,683 for the three-month period ending May 2026. That was approximately 8.3% higher than the comparable period one year earlier.
What were mortgage rates in early July 2026?
Freddie Mac reported a national average rate of 6.43% for a 30-year fixed mortgage and 5.79% for a 15-year fixed mortgage as of July 2, 2026. Actual borrower rates varied by lender, credit profile, loan type, points, fees, down payment and property.
Can this archive determine the current value of my home?
No. This archive provides historical market context. A current property valuation should use recent neighborhood-level comparable sales, current active competition, condition, improvements, lot characteristics, location and property type.
How should buyers use this archive today?
Buyers can use this page to compare historical July 2026 market conditions with today’s inventory, mortgage rates, pricing and days on market. Current decisions should be based on current listings and recent comparable sales.
Who can help compare this archive with the current Kootenai County market?
David Puccetti with PNW Home Sales can help buyers and sellers compare archived market data with current listings, recent comparable sales and today’s market conditions in Coeur d’Alene, Post Falls, Hayden, Rathdrum and Kootenai County.


