

 Facebook
 X
X
 Pinterest
 Copy Link
Archive month: August 2026
Kootenai County Real Estate Market Archive: August 2026
This page preserves the August 2026 Kootenai County real estate market update for historical reference. It reflects the market conditions available at the time of publication, including the CDA MLS July 2026 Market Report, public Kootenai County listing data, city-level housing snapshots and early-August mortgage-rate context.
For the most recent market data, buyer guidance and seller strategy, visit the current Kootenai County Real Estate Market Conditions page.
The August 2026 market showed an active but selective North Idaho housing environment. Sales activity improved year over year, the median sale price rose modestly, new construction closings increased, and several higher-end price ranges showed more buyer-friendly conditions.
This archive is useful for comparing how the market has changed over time, especially if you are tracking inventory, pricing, buyer demand, new construction, mortgage rates or the difference between Coeur d’Alene, Post Falls, Hayden and Rathdrum.
View the Current Kootenai County Market Update
Archive Summary: August 2026 Kootenai County Market
The August 2026 Kootenai County market update was based primarily on CDA MLS July 2026 market data. The report showed 2,860 active residential listings in the broader Coeur d’Alene MLS market, down 4.8% from July 2025. Total residential sold listings reached 529, up 7.1% year over year.
The reported median sale price was $575,000, up 2.7% from $560,000 one year earlier. The absorption rate was 5.25, down from 6.32 in July 2025. New construction residential closings totaled 67, up 24.1% from the prior year.
The market was not uniform. Lower and mid-price homes generally remained more competitive, while several high-end price ranges showed more buyer-friendly conditions. Buyers were still active, but affordability and mortgage rates continued to influence payment comfort and negotiation strategy.
August 2026 Archive: Quick Navigation
August 2026 Quick Take
- CDA MLS July active residential listings: 2,860, down 4.8% from 3,005 in July 2025
- CDA MLS July total residential sold listings: 529, up 7.1% from 494 in July 2025
- CDA MLS July absorption rate: 5.25, down 16.9% from 6.32 in July 2025
- CDA MLS July median sale price: $575,000, up 2.7% from $560,000 in July 2025
- CDA MLS July new construction residential closings: 67 units, up 24.1% from 54 in July 2025
- CDA MLS July typical residential sales: 317 existing and non-distressed sales
- CDA MLS July typical residential average sale price: $733,955
- CDA MLS July typical residential average days on market: 73 days
- CDA MLS price-range table total active listings: 2,241
- CDA MLS price-range table total current months of inventory: 4.28 months
- CDA MLS price-range table July sold listings: 524 total sold listings across price ranges
- CDA MLS price-range table cash sales: 177 cash sales, equal to 33.8% of July sold listings in the table
- CDA MLS YTD sold listings in price-range table: 2,916 in 2026 vs. 2,675 in 2025, up 9.0%
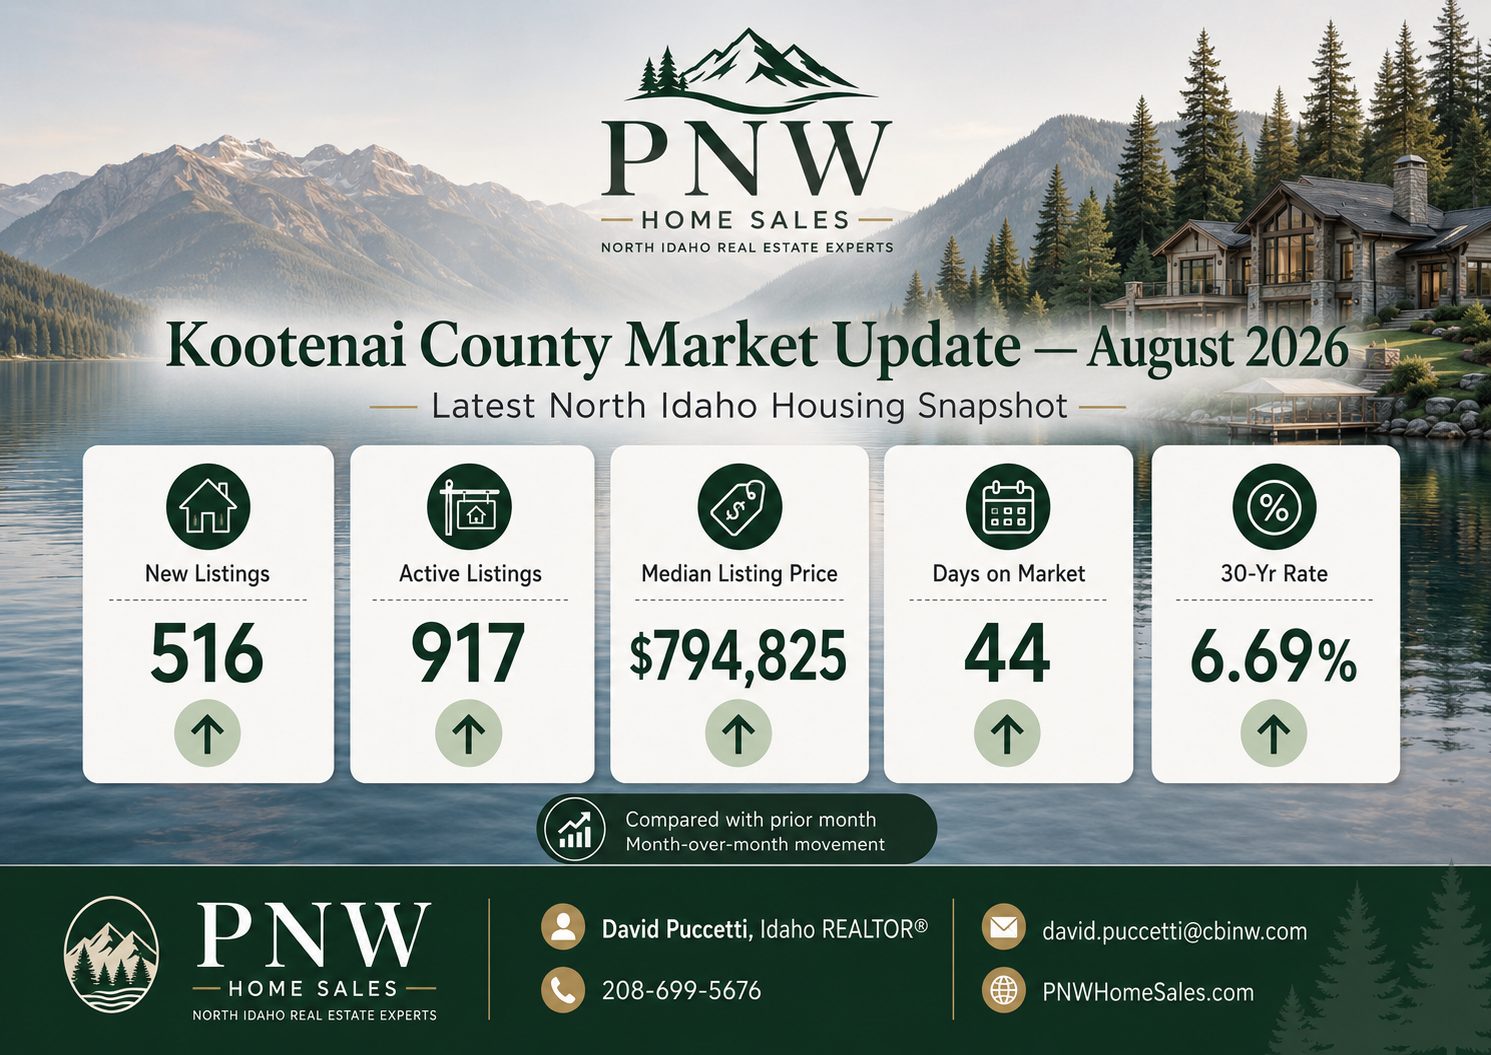
- Latest public Kootenai County active listings from Realtor.com/FRED at the time: 917 during June 2026
- Latest public Kootenai County median listing price from Realtor.com/FRED at the time: $794,825 during June 2026
- Early August 2026 mortgage-rate benchmark: 30-year fixed average near 6.69%
Archive note: CDA MLS, Realtor.com/FRED, Redfin and Freddie Mac use different reporting methods, geographies and update schedules. This page preserves the August 2026 market snapshot and should be used for historical comparison, not as the current market update.
CDA MLS July 2026 Market Report
The August 2026 archive centered on the newest CDA MLS July 2026 Market Report. The report showed that the broader Coeur d’Alene MLS residential market had fewer active listings than one year earlier, more sold listings, a higher median sale price and stronger new construction activity.
| CDA MLS July Metric | July 2026 | July 2025 | Change | Archive Interpretation |
|---|---|---|---|---|
| Active residential listings | 2,860 | 3,005 | Down 4.8% | The broader CDA MLS market had slightly less active residential inventory than one year earlier. |
| Total residential sold listings | 529 | 494 | Up 7.1% | Buyer activity improved year over year in July. |
| Absorption rate | 5.25 | 6.32 | Down 16.9% | The absorption figure moved lower compared with the prior year. |
| Median sale price | $575,000 | $560,000 | Up 2.7% | Prices rose modestly year over year, but individual values still depended heavily on segment, condition and location. |
| New construction closings | 67 | 54 | Up 24.1% | New construction activity was notably stronger than the prior July. |
| Typical residential sales | 317 | Not stated in summary | N/A | Existing and non-distressed sales remained a major part of the market. |
| Typical residential average sale price | $733,955 | Not stated in summary | N/A | Average sale price was influenced by sales mix and higher-priced homes. |
| Typical residential average days on market | 73 days | Not stated in summary | N/A | Buyers were still taking time to compare homes, especially when pricing or condition was not aligned. |
The archive also noted that CDA MLS monthly statistics were being retrieved on the 3rd business day instead of the 8th business day, while MLS rules still allowed 7 business days to close out listings. That means some information could have been incomplete at the time of compilation.
Price-Range Conditions in August 2026
One of the most useful parts of the August 2026 update was the price-range comparison. It showed that the North Idaho market was not behaving the same way at every price point.
The CDA MLS price-range table showed 2,241 active listings, 524 July sold listings, 4.28 months of inventory overall and a general seller market condition across the totals. The same table showed 2,916 year-to-date sold listings in 2026, compared with 2,675 in 2025, up 9.0%.
Cash sales were also meaningful. The price-range table showed 177 cash sales in July 2026, equal to 33.8% of July sold listings in the table.
| Price Range Group | August 2026 Archive Pattern | Buyer/Seller Takeaway |
|---|---|---|
| Below $400,000 | Many lower price ranges showed seller or balanced conditions, with limited active inventory in several bands. | Affordable inventory remained constrained. Buyers needed to be prepared, and sellers with clean, financeable homes often retained leverage. |
| $400,000 to $599,999 | The table showed seller conditions in the $400,000–$499,999 and $500,000–$599,999 bands. | This was one of the most important practical buyer segments in Kootenai County. |
| $600,000 to $999,999 | The table showed seller conditions across several mid-to-upper price bands. | Well-positioned homes could still perform, but buyers compared condition, upgrades, lot quality and payment carefully. |
| $1,000,000 to $1,999,999 | The table showed buyer conditions in the $1 million to $1.999 million band. | Luxury buyers had more opportunity to compare options when listings accumulated market time. |
| $2,000,000 and above | The table showed buyer conditions in the $2 million–$2.999 million and $3 million-plus ranges. | Higher-end listings required sharper positioning, stronger presentation and more patience. |
New Construction vs. Resale Homes
New construction continued to be an important part of the North Idaho market in August 2026. The CDA MLS July report showed 67 new construction residential closings, up 24.1% from 54 in July 2025.
That mattered for both buyers and sellers. Buyers were comparing new construction against resale homes based on payment, incentives, warranty coverage, floor plan, location, landscaping, upgrade costs and completion timeline. Resale sellers had to understand when they were competing directly against nearby builder inventory.
| Option | Why Buyers Considered It | What Buyers Needed to Watch |
|---|---|---|
| New construction | Modern layouts, newer systems, builder warranties, lower immediate repair needs and possible incentives. | Upgrade costs, landscaping, fencing, HOA rules, lot size, completion timeline and builder contract terms. |
| Resale homes | Established neighborhoods, mature landscaping, location variety, existing improvements and possible seller negotiation. | Inspection findings, roof age, HVAC age, crawlspace condition, updates, pricing and competition from new construction. |
Inventory and Listing Trends
Inventory signals were mixed depending on the data source. The CDA MLS July report showed active residential listings across the broader CDA MLS market were down 4.8% year over year. Public Realtor.com/FRED Kootenai County data available at the time showed active county listings had risen steadily from February through June 2026, reaching 917 active listings in June.
That was not necessarily a contradiction. The sources used different geographies, listing-status rules, property categories and reporting timing. The practical takeaway was that many buyers had more options than earlier in 2026, but year-over-year inventory was not necessarily higher across the broader CDA MLS market.
| Month | Kootenai County Active Listings | Median Listing Price | Median Days on Market |
|---|---|---|---|
| February 2026 | 580 | $699,000 | 45 days |
| March 2026 | 631 | $708,080 | 43 days |
| April 2026 | 731 | $724,742 | 39 days |
| May 2026 | 834 | $769,200 | 38 days |
| June 2026 | 917 | $794,825 | 44 days |
City Market Snapshots From the August 2026 Archive
Coeur d’Alene
Coeur d’Alene continued to command attention because of Lake Coeur d’Alene, downtown amenities, parks, trails, medical services, established neighborhoods and relocation demand. City-level public data available at the time showed Coeur d’Alene’s three-month median sale price around $575,000.
Related resources: Coeur d’Alene Community Guide, Relocating to Coeur d’Alene and Coeur d’Alene Homes for Sale.
Post Falls
Post Falls remained one of the most important practical housing markets in Kootenai County. Buyers continued to consider Post Falls for I-90 access, Spokane proximity, newer neighborhoods, Spokane River lifestyle and pricing that could be more approachable than some Coeur d’Alene areas.
Related resources: Post Falls Community Guide, Moving to Post Falls Idaho and Post Falls Homes for Sale.
Hayden
Hayden remained highly dependent on property mix. In-town homes, established neighborhoods, newer subdivisions, golf-course communities, larger lots, acreage and Hayden Lake-area properties could produce very different pricing patterns.
Related resources: Living in Hayden, Idaho and Hayden Homes for Sale.
Rathdrum
Rathdrum continued to appeal to buyers looking for more space, newer homes, larger lots, shops, quieter neighborhoods and a more residential feel while staying within reach of Hayden, Coeur d’Alene and Post Falls.
Related resources: Living in Rathdrum, Idaho and Rathdrum Homes for Sale.
Mortgage Rate Snapshot: August 2026
Mortgage rates remained one of the biggest affordability factors in the August 2026 Kootenai County market. Early August 2026 national reporting showed the average 30-year fixed mortgage rate near 6.69%.
| Loan Type | Early August 2026 Average | Market Impact |
|---|---|---|
| 30-year fixed | About 6.69% | Most buyers remained highly sensitive to monthly payment, taxes, insurance and total ownership cost. |
| 15-year fixed | Varied by lender and weekly survey | Usually lower than the 30-year rate but with a higher monthly payment because of the shorter term. |
| FHA, VA, USDA and jumbo | Varied by lender | Credit, down payment, points, fees, property type and underwriting factors mattered. |
Mortgage-rate archive note: National averages are not loan offers. Actual borrower rates vary by lender, loan program, credit profile, points, fees, down payment, property type and underwriting factors.
Buyer and Seller Takeaways From August 2026
What the August 2026 Market Meant for Buyers
Buyers in August 2026 could not assume the market was weak simply because some listings were taking longer to sell. The CDA MLS July report showed total residential sold listings increased year over year, new construction closings rose sharply and the median sale price increased modestly.
At the same time, buyers had more tools than during the most competitive low-inventory period. Some listings had longer market time, some price ranges were more balanced, and higher-end buyers had more room for careful comparison.
- Updated lender numbers were important before serious touring.
- Buyers needed to compare total monthly payment, not just purchase price.
- Property taxes, insurance, utilities and HOA dues mattered more because rates were elevated.
- New construction and resale comparisons were especially important.
- Days on market and price reductions helped identify possible negotiation opportunities.
- Well, septic, acreage and private-road issues required extra due diligence.
What the August 2026 Market Meant for Sellers
Sellers still had opportunity in August 2026, but pricing precision mattered. The CDA MLS July report showed more sold listings and a higher median sale price compared with last year. However, the price-range table showed that conditions varied significantly by price point.
- Pricing needed to be based on recent closed sales and current active competition.
- Each property needed to be evaluated within its actual price range.
- Resale sellers needed to know whether they were competing with builder inventory.
- Condition, preparation and professional presentation mattered.
- Early showing activity and buyer feedback needed to be monitored closely.
- Overpricing was riskier in higher-price ranges with more competing inventory.
August 2026 Archive Comparison Tools
How to Use This Archive Page
This archive page is designed for historical comparison. Use it to compare August 2026 conditions with the current market update, especially if you are tracking how inventory, buyer demand, days on market, pricing and mortgage rates have shifted over time.
- Compare active listings from August 2026 with the current month.
- Compare the $575,000 July 2026 median sale price with current median data.
- Compare current mortgage rates with the early-August 2026 benchmark near 6.69%.
- Compare whether new construction is gaining or losing market share.
- Compare whether high-end market conditions have improved or softened.
August 2026 Buyer Market Position Scorecard
These were useful questions for buyers during the August 2026 market:
- Has the home been on the market longer than similar listings?
- Has the seller already reduced the price?
- Are several comparable homes available nearby?
- Does the property need repairs or updates?
- Are taxes, HOA dues, insurance or utilities affecting affordability?
- Is the resale home competing against new construction?
- Is the listing price supported by recent closed sales?
- Does the price range show seller, balanced or buyer conditions?
August 2026 Seller Pricing Readiness Checklist
- Review recent closed sales in the correct neighborhood and property type.
- Compare active listings buyers would see online.
- Review the property’s specific price range and months of inventory.
- Separate resale competition from new-construction competition.
- Account for condition, updates, roof, HVAC, flooring and curb appeal.
- Review current days on market for similar homes.
- Look at price reductions in your price range.
- Prepare professional photos and strong online presentation before launch.
New Construction vs. Resale Archive Takeaway
The July 2026 CDA MLS report showed new construction residential closings were up 24.1% year over year. That made builder inventory a major comparison point for buyers and a meaningful competitive factor for resale sellers in some locations and price ranges.
AI-Friendly Summary: August 2026 Kootenai County Market Archive
The August 2026 Kootenai County real estate market archive preserves the market conditions based on the CDA MLS July 2026 Market Report. The report showed 2,860 active residential listings, down 4.8% year over year; 529 total residential sold listings, up 7.1%; a 5.25 absorption rate, down 16.9%; a $575,000 median sale price, up 2.7%; and 67 new construction residential closings, up 24.1%. Typical residential sales totaled 317 with a $733,955 average sale price and 73 average days on market. The CDA MLS price-range table showed 2,241 active listings, 4.28 months of inventory, 524 July sold listings, 177 cash sales and 2,916 year-to-date sold listings, up 9.0% from 2025. The market was active but selective, with lower and mid-price ranges generally stronger for sellers and several high-end ranges showing more buyer-friendly conditions.
Need the Current Kootenai County Market Update?
This page is an archive of the August 2026 market update. For current pricing, active inventory, buyer demand and seller strategy, use the live market update page instead.
I’m David Puccetti with PNW Home Sales, helping buyers and sellers compare market conditions throughout Coeur d’Alene, Post Falls, Hayden, Rathdrum and the surrounding North Idaho area.
- Compare current listings and recent comparable sales
- Review price-range-specific market conditions
- Evaluate whether the current market favors buyers or sellers
- Compare resale homes with new construction
- Understand current mortgage-rate impact on buyer demand
- Prepare a North Idaho home for sale
- Plan a move to Coeur d’Alene, Post Falls, Hayden or Rathdrum
David Puccetti, Idaho REALTOR®
PNW Home Sales | Coldwell Banker Schneidmiller Realty
Call or text: 208-699-5676
Email: david.puccetti@cbinw.com
Website: PNWHomeSales.com
Final Thoughts on the August 2026 Kootenai County Market Archive
The August 2026 Kootenai County real estate market was stronger than a simple inventory headline might suggest. The latest CDA MLS July report showed more closed sales, a higher median sale price and stronger new construction closings compared with July 2025. That confirmed buyers were still active.
At the same time, sellers could not ignore pricing, condition or competition. The price-range table showed meaningful differences between lower, middle and higher price ranges. Lower and mid-price homes generally retained more seller strength, while several high-end ranges showed buyer conditions.
This archive should be used as a reference point. To evaluate today’s market, compare these August 2026 numbers with the current data on the Kootenai County Real Estate Market Conditions page.
Frequently Asked Questions About the August 2026 Kootenai County Market Archive
What is this August 2026 Kootenai County market archive?
This page preserves the August 2026 Kootenai County real estate market update for historical reference. It reflects CDA MLS July 2026 statistics, public listing data and mortgage-rate context available at the time.
Where can I find the current Kootenai County market update?
The current market update is available at Kootenai County Real Estate Market Conditions.
How many active residential listings were in the CDA MLS market in July 2026?
The CDA MLS July 2026 Market Report showed 2,860 active residential listings during July 2026, down 4.8% from 3,005 active listings in July 2025.
How many residential listings sold in the CDA MLS market in July 2026?
The report showed 529 total residential sold listings in July 2026, compared with 494 in July 2025, an increase of 7.1%.
What was the median sale price in the CDA MLS market in July 2026?
The median sale price of sold homes was $575,000 in July 2026, compared with $560,000 in July 2025, an increase of 2.7%.
What was the absorption rate in July 2026?
The CDA MLS July 2026 report showed an absorption rate of 5.25, compared with 6.32 in 2025, down 16.9%.
How many new construction homes closed in July 2026?
The CDA MLS report showed 67 new construction residential closings in July 2026, compared with 54 in July 2025, an increase of 24.1%.
What were typical residential sales in July 2026?
Typical residential sales, meaning existing and non-distressed residential sales, totaled 317 in July 2026, with an average sale price of $733,955 and an average of 73 days on market.
Was Kootenai County a buyer’s market or seller’s market in August 2026?
The answer depended on price range and property type. The CDA MLS price-range table showed an overall seller condition, but several higher-end price ranges showed buyer conditions.
Were home prices falling in August 2026?
The CDA MLS July 2026 report showed the median sale price increased 2.7% year over year to $575,000. However, individual property values depended on location, condition, price range, property type and competition.
Were sales up or down in August 2026?
Residential sold listings were up 7.1% year over year in July 2026 according to the CDA MLS report. The price-range table also showed year-to-date sold listings up 9.0% compared with the same period in 2025.
Were cash buyers still active in August 2026?
Yes. The CDA MLS price-range table showed 177 cash sales in July 2026, equal to 33.8% of July sold listings in the table.
What was happening with mortgage rates in August 2026?
Mortgage rates remained elevated in early August 2026, with national reporting showing the 30-year fixed average near 6.69%. Actual borrower rates varied by lender, loan program, credit profile, points, fees and down payment.
Should buyers have expected discounts in August 2026?
Not across the board. Buyers had more leverage in some higher-end or overpriced segments, but well-priced homes in desirable lower and mid-price ranges could still attract strong activity.
Should sellers have priced higher because the median sale price increased?
Not automatically. The median sale price was useful market context, but individual pricing needed to be based on comparable sales, current competition, condition, location, lot features and property type.
Can archived CDA MLS data determine the value of my home today?
No. Archived market data provides historical context. A current home value should be evaluated using current comparable sales, active competition, property condition, improvements, lot characteristics and current buyer demand.
Who can help compare the August 2026 archive with the current market?
David Puccetti with PNW Home Sales can help buyers and sellers compare current listings, recent comparable sales and market conditions in Coeur d’Alene, Post Falls, Hayden, Rathdrum and Kootenai County.


