

 Facebook
 X
X
 Pinterest
 Copy Link
Archived market report: September 2026
Kootenai County Real Estate Market Update September 2026: Prices, Inventory, Mortgage Rates and Buyer Trends
This page preserves the September 2026 Kootenai County real estate market update as a historical reference. The statistics and market commentary below reflect information available when this report was originally published.
The Kootenai County real estate market in September 2026 remained active, but more selective. Public Realtor.com/FRED inventory data for August 2026 showed more active listings than July, slightly lower median listing prices than the prior month, longer median days on market, and continued affordability pressure from mortgage rates.
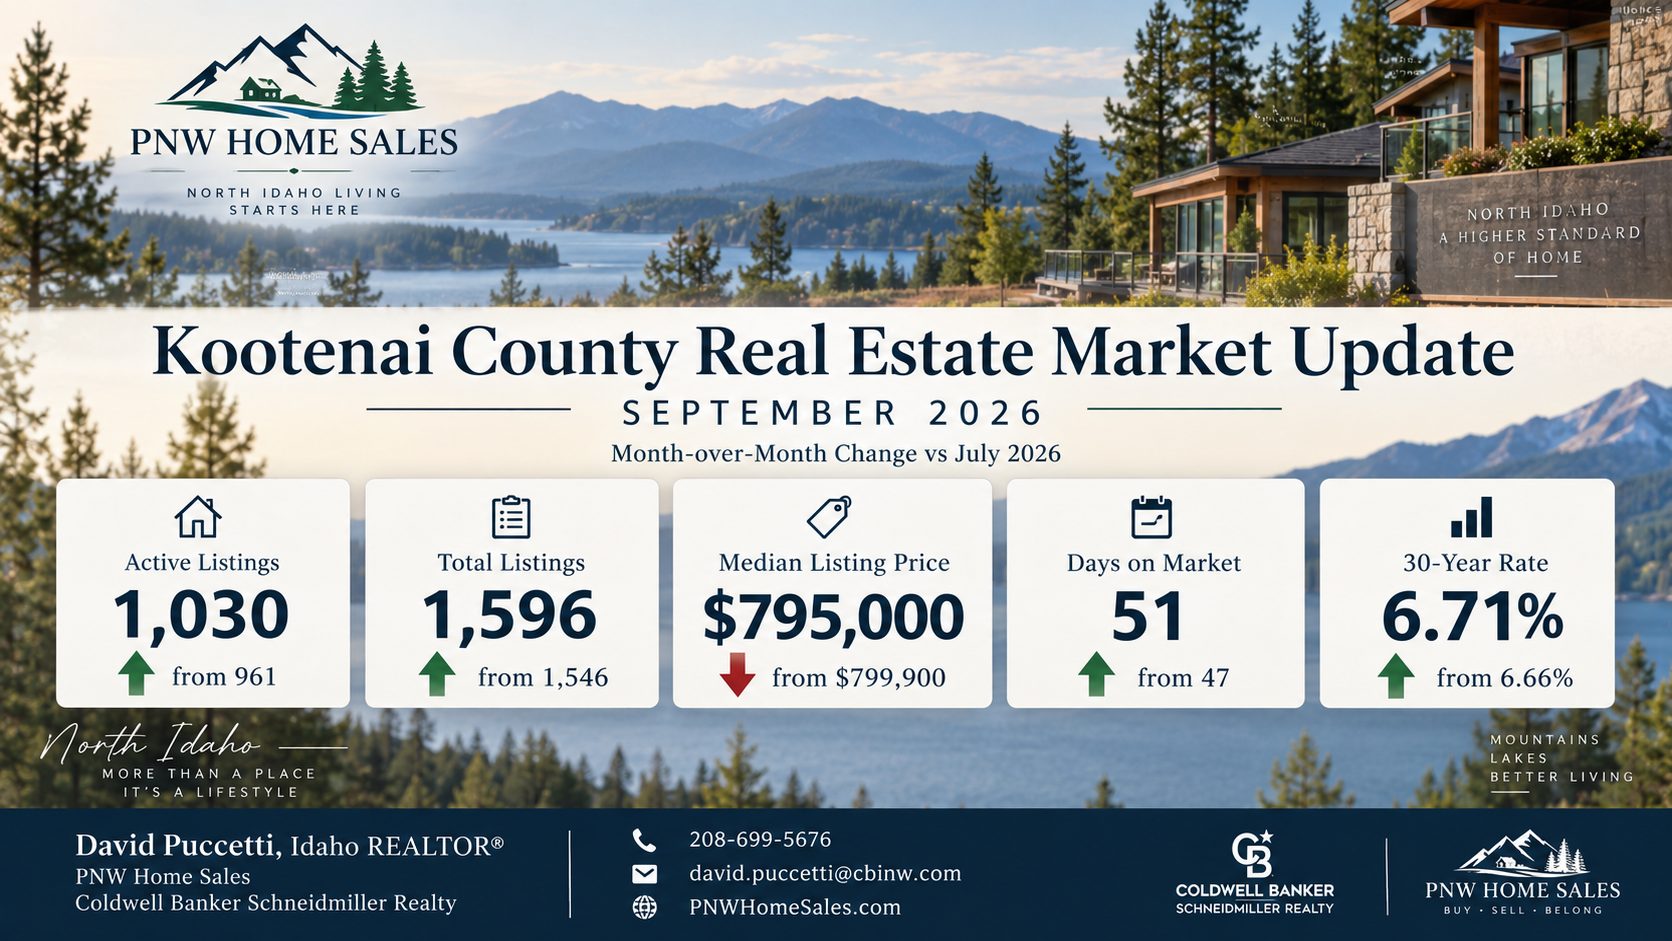
The latest public county-level data available for this archived report showed 1,030 active listings in Kootenai County during August 2026, up from 961 in July. The median listing price was $795,000, down slightly from $799,900 in July but still higher than $750,000 one year earlier. Median days on market moved to 51 days, up from 47 in July but lower than 59 days one year earlier.
The biggest September takeaway was that buyers had more active choices than earlier in the year, but the market was not weak across the board. Well-priced homes in desirable price ranges could still attract attention, while overpriced homes, homes with condition issues, higher-priced listings and properties competing against new construction often required sharper pricing and stronger presentation.
Mortgage rates remained one of the largest affordability variables. Freddie Mac reported the national average 30-year fixed mortgage rate at 6.71% as of September 3, 2026.
Looking for Current Kootenai County Market Conditions?
This is an archived September 2026 market report. Prices, inventory, mortgage rates and buyer activity have changed since these statistics were published.
For the newest housing data and current buyer and seller analysis, visit the main market update page.
You can also compare current real estate opportunities through Kootenai County homes for sale, Coeur d’Alene homes for sale, Post Falls homes for sale, Hayden homes for sale and the Kootenai County cities and communities guide.
September 2026 Kootenai County Real Estate Market Summary
The September 2026 Kootenai County housing market was best described as active but selective. Public Realtor.com/FRED data for August 2026 showed 1,030 active listings, up from 961 in July but below 1,115 one year earlier.
The median listing price was $795,000, down slightly from $799,900 in July but up from $750,000 one year earlier. Median days on market rose to 51 days, up from 47 in July but still below 59 days from August 2025.
Buyers had more choices than earlier in 2026, but that did not mean every segment favored buyers. Lower and mid-price homes that were well-priced, clean and move-in ready could still compete strongly.
Higher-priced listings, homes needing updates, rural properties with added maintenance, and properties competing against new construction often required stronger pricing and better presentation.
September 2026 Market Snapshot
| Metric | Latest Public Data | Previous Month | Year Ago | Market Direction |
|---|---|---|---|---|
| Active listings | 1,030 in August 2026 | 961 in July 2026 | 1,115 in August 2025 | Up month over month, but still below last year. |
| Total listings | 1,596 in August 2026 | 1,546 in July 2026 | Varies by dataset and reporting table | Total active plus pending inventory increased from July. |
| Median listing price | $795,000 in August 2026 | $799,900 in July 2026 | $750,000 in August 2025 | Slightly lower month over month, still higher year over year. |
| Median days on market | 51 days in August 2026 | 47 days in July 2026 | 59 days in August 2025 | Slower than July, but faster than last year. |
| Median list price per square foot | $378 in August 2026 | $383 in July 2026 | $358 in August 2025 | Slightly lower month over month, higher year over year. |
| 30-year fixed mortgage rate | 6.71% as of September 3, 2026 | 6.66% one week earlier | 6.50% one year earlier | Higher than the prior week and prior year. |
Data note: Realtor.com/FRED county inventory data reflects Kootenai County public listing inventory and updates monthly. CDA MLS reports may use different geography, property categories, status rules and reporting timing. Freddie Mac mortgage rates are national averages and not borrower-specific loan quotes.
September 2026 Market Archive: Quick Navigation
September 2026 Quick Take
- Latest public Kootenai County active listings: 1,030 in August 2026, up from 961 in July but down from 1,115 one year earlier.
- Latest public Kootenai County total listings: 1,596 in August 2026, up from 1,546 in July.
- Latest public Kootenai County median listing price: $795,000 in August 2026, down from $799,900 in July but up from $750,000 one year earlier.
- Latest public Kootenai County median days on market: 51 days in August 2026, up from 47 in July but down from 59 one year earlier.
- Latest public Kootenai County median list price per square foot: $378 in August 2026, down from $383 in July but up from $358 one year earlier.
- Mortgage-rate benchmark: Freddie Mac reported the 30-year fixed-rate mortgage at 6.71% as of September 3, 2026.
- Buyer takeaway: More active inventory gave buyers more choices, but lower and mid-price homes could still be competitive when priced well.
- Seller takeaway: Pricing, presentation and condition mattered because buyers were comparing payment, inventory and alternatives more carefully.
- Market condition: Selective, price-range-dependent and sensitive to mortgage rates.
Historical Public Housing Data for Kootenai County
The newest public county-level data available for the original September update came from Realtor.com housing inventory metrics distributed through FRED.
These figures were especially useful for tracking public listing inventory, listing-price direction and days on market. They were not the same as a local MLS closed-sales report, but they provided timely market context.
| Public Data Metric | August 2026 | July 2026 | Month Change | Practical Meaning |
|---|---|---|---|---|
| Active listings | 1,030 | 961 | Up about 7.2% | Buyers had more active choices heading into September than they did in July. |
| Total listings | 1,596 | 1,546 | Up about 3.2% | The combined active and pending listing count moved higher from July. |
| Median listing price | $795,000 | $799,900 | Down about 0.6% | The asking-price median eased slightly, but the market remained expensive relative to many areas. |
| Median days on market | 51 days | 47 days | Up 4 days | Listings took longer to move than in July, which created more room for buyer evaluation. |
| Median listing price per square foot | $378 | $383 | Down about 1.3% | Price-per-square-foot pressure eased slightly month over month. |
CDA MLS Context From the Prior Local Market Report
The original September market page also referenced the prior CDA MLS July 2026 Market Report. That local MLS data provided closed-sale and broader residential-market context while the September update added public Realtor.com/FRED August inventory data.
| CDA MLS July 2026 Metric | July 2026 | July 2025 | Change | How to Use It |
|---|---|---|---|---|
| Active residential listings | 2,860 | 3,005 | Down 4.8% | Shows broader CDA MLS inventory context from the prior local report. |
| Total residential sold listings | 529 | 494 | Up 7.1% | Shows buyer activity was still present in the prior MLS report. |
| Absorption rate | 5.25 | 6.32 | Down 16.9% | Shows the market was not uniformly slow despite affordability pressure. |
| Median sale price | $575,000 | $560,000 | Up 2.7% | Useful as closed-sale context, but not a direct pricing formula for every home. |
| New construction closings | 67 | 54 | Up 24.1% | Confirms new construction remained an important buyer alternative and resale competitor. |
Inventory and Listing Trends
The most important shift in the September 2026 update was inventory. Kootenai County active listings moved from 961 in July to 1,030 in August, an increase of about 7.2% month over month.
Total listings moved from 1,546 in July to 1,596 in August.
That gave buyers more properties to compare, especially in segments where homes were not priced aggressively or several similar listings were available.
However, active listings were still below the August 2025 level of 1,115, so the year-over-year data did not indicate an inventory surge.
| Month | Active Listings | Median Listing Price | Median Days on Market |
|---|---|---|---|
| April 2026 | 731 | $723,717 | Reported in monthly FRED series |
| May 2026 | 834 | $769,200 | Reported in monthly FRED series |
| June 2026 | 917 | $794,825 | Reported in monthly FRED series |
| July 2026 | 961 | $799,900 | 47 days |
| August 2026 | 1,030 | $795,000 | 51 days |
The inventory trend was helpful for buyers, but it also created a more competitive environment among sellers. When buyers had more choices, listings needed to be easier to justify.
Price, condition, photos, location, lot quality, floor plan, updates, inspection risk and monthly payment all mattered more.
Prices and Listing Strategy in September 2026
The median listing price dipped only slightly from July to August, moving from $799,900 to $795,000.
That was not a major price decline. It was better interpreted as modest cooling in the asking-price mix after a strong run-up earlier in 2026.
Year over year, the median listing price remained higher than August 2025.
For sellers, the lesson was not that prices were falling sharply. The lesson was that buyers had become more selective.
Why Median Listing Price Can Be Misleading
Median listing price reflects the mix of homes currently listed for sale. More waterfront homes, acreage properties, luxury listings, larger homes and new construction can push the listing-price median higher.
A lower-priced segment may behave differently than the countywide median suggests.
Buyers and sellers needed to compare:
- Recent closed sales in the correct neighborhood
- Active competition in the same price range
- Pending sales when available
- Days on market for comparable homes
- Price reductions among similar listings
- Condition and inspection risk
- New construction competition
- Total monthly payment after taxes, insurance and HOA dues
For buyer budgeting, review Hidden Costs of Buying a Home in North Idaho and North Idaho Home Inspection Checklist.
Mortgage Rate Snapshot: September 2026
Mortgage rates continued to shape the Kootenai County housing market. Freddie Mac reported the national average 30-year fixed-rate mortgage at 6.71% as of September 3, 2026, up from 6.66% the prior week and 6.50% one year earlier.
Freddie Mac also reported the 15-year fixed-rate mortgage at 6.04%.
| Loan Type | September 3, 2026 Average | Prior Week | Year Ago | Market Impact |
|---|---|---|---|---|
| 30-year fixed | 6.71% | 6.66% | 6.50% | Kept buyers focused on monthly payment and total ownership cost. |
| 15-year fixed | 6.04% | 5.98% | 5.60% | Lower term length, but payment could be much higher than a 30-year loan. |
Mortgage-rate note: Freddie Mac PMMS figures are national averages. Actual borrower rates depend on lender, credit profile, loan type, down payment, points, fees, property type and underwriting factors.
For financing information, review Comparing Home Loans in North Idaho.
City Market Snapshots: Coeur d’Alene, Post Falls, Hayden and Rathdrum
Coeur d’Alene Housing Market
Coeur d’Alene remained the highest-profile market in Kootenai County because of Lake Coeur d’Alene, downtown, parks, restaurants, healthcare access, community identity and relocation demand.
It was also highly segment-specific. Downtown homes, condos, lake-proximate homes, luxury homes, older resale homes and new construction could all move differently.
Related resources: Coeur d’Alene community guide, relocating to Coeur d’Alene, Coeur d’Alene homes for sale and Coeur d’Alene waterfront homes for sale.
Post Falls Housing Market
Post Falls remained one of the most practical housing markets in North Idaho. Its location between Coeur d’Alene and Spokane made it attractive for buyers seeking Idaho residency, I-90 access, Spokane River recreation and newer neighborhoods.
Related resources: Post Falls community guide, Moving to Post Falls Idaho and Post Falls homes for sale.
Hayden Housing Market
Hayden continued to attract buyers seeking a quieter residential setting near Coeur d’Alene, with access to Hayden Lake, golf, shopping, schools, healthcare and established neighborhoods.
Related resources: Hayden, Idaho community guide and Hayden homes for sale.
Rathdrum Housing Market
Rathdrum remained attractive for buyers looking for more space, newer homes, shops, larger lots, quieter neighborhoods and a more residential feel while staying within reach of Hayden, Coeur d’Alene and Post Falls.
Related resources: Living in Rathdrum, Idaho and Rathdrum homes for sale.
What the September 2026 Market Meant for Buyers
Buyers had more active inventory than they did in July, but the market was still not uniform.
The strongest negotiating opportunities were often found where listings had accumulated market time, sellers had already adjusted pricing, several comparable homes were available, or a property had condition issues that reduced competition.
- Get updated lender numbers before touring seriously.
- Compare total monthly payment instead of only purchase price.
- Review property taxes, insurance, utilities and HOA dues.
- Watch days on market and price reductions.
- Separate new construction from resale comparisons.
- Understand well, septic, private-road and acreage issues when applicable.
- Compare the correct price range instead of relying only on broad county averages.
- Evaluate inspection risk before writing an offer.
- Recognize that lower-priced and move-in-ready homes could still be competitive.
What the September 2026 Market Meant for Sellers
Sellers still had opportunity, but the market was less forgiving than during the tightest inventory periods.
Active listing count increased from July to August, median days on market rose, and mortgage rates remained high enough to affect buyer payment comfort.
- Price against recent closed sales and current active competition.
- Review the exact price range instead of relying on the countywide median.
- Know whether the property competes with new construction.
- Prepare the home before launch.
- Use professional photography and clear online presentation.
- Address obvious maintenance issues before listing.
- Watch showing activity during the first two weeks.
- Respond quickly if buyer feedback points to pricing or condition concerns.
- Understand how current mortgage rates affect buyer payment comfort.
- Avoid pricing based solely on what unsold competitors are asking.
Buying or Selling in Kootenai County Now?
This September 2026 report is preserved for historical reference. Current real estate decisions should be based on today’s listings, recent comparable sales, property condition, buyer demand, mortgage rates and competition within your specific price range.
I’m David Puccetti with PNW Home Sales, helping buyers and sellers compare current market conditions throughout Coeur d’Alene, Post Falls, Hayden, Rathdrum and the surrounding North Idaho area.
- Compare Coeur d’Alene, Post Falls, Hayden, Rathdrum and nearby communities.
- Review current listings and recent comparable sales.
- Evaluate pricing, condition, competition and negotiation opportunities.
- Compare resale homes with new construction options.
- Analyze your specific price range and market conditions.
- Plan an out-of-state relocation to North Idaho.
- Prepare and position a Kootenai County property for sale.
David Puccetti, Idaho REALTOR®
PNW Home Sales | Coldwell Banker Schneidmiller Realty
Call or text: 208-699-5676
Email: david.puccetti@cbinw.com
Website: PNWHomeSales.com
September 2026 Market Data Sources and Methodology
This September 2026 Kootenai County market archive uses multiple public and MLS-based sources because county listing statistics, CDA MLS market reports and mortgage-rate data update on different schedules.
- Coeur d’Alene Regional REALTORS® Market Data
- FRED / Realtor.com Active Listing Count in Kootenai County
- FRED / Realtor.com New Listing Count in Kootenai County
- FRED / Realtor.com Total Listing Count in Kootenai County
- FRED / Realtor.com Median Listing Price in Kootenai County
- FRED / Realtor.com Median Days on Market in Kootenai County
- FRED / Realtor.com Median Listing Price Per Square Foot
- Freddie Mac Primary Mortgage Market Survey
Public market datasets may be revised after publication. Statistics from different providers may vary because of geographic boundaries, property types, source records, reporting periods and calculation methods. This page is intended as a historical market archive and is not an appraisal, guarantee of value, financial advice or prediction of future market performance.
What You Should Read Next


Final Thoughts on the September 2026 Kootenai County Market
The September 2026 Kootenai County real estate market was more nuanced than a simple buyer-market or seller-market label.
Active listings increased from July to August, median days on market moved higher, and mortgage rates remained elevated. Those conditions gave buyers more room to compare homes and make careful decisions.
At the same time, median listing prices remained high, active inventory was still below the prior year, and well-positioned homes could continue attracting serious buyers.
The strongest lesson from the September market was that property-specific analysis mattered. Coeur d’Alene, Post Falls, Hayden, Rathdrum, waterfront properties, acreage homes, new construction, resale homes and entry-level listings could all behave differently.
For current conditions, use the current Kootenai County Real Estate Market Conditions page.
Frequently Asked Questions About the September 2026 Kootenai County Real Estate Market
How many active listings were in Kootenai County?
Public Realtor.com/FRED data showed 1,030 active listings in Kootenai County during August 2026, up from 961 in July 2026 and down from 1,115 in August 2025.
What was the median listing price in Kootenai County?
The median listing price in Kootenai County was $795,000 in August 2026 according to public Realtor.com/FRED data. That was slightly lower than $799,900 in July but higher than $750,000 one year earlier.
How long were homes taking to sell?
Public Realtor.com/FRED data showed median days on market at 51 days in August 2026. That was up from 47 days in July but down from 59 days in August 2025.
Was Kootenai County inventory rising?
Yes. Active listings increased from 961 in July 2026 to 1,030 in August 2026. However, active listings remained below the August 2025 level of 1,115.
Were Kootenai County home prices falling?
The median listing price moved slightly lower from July to August, from $799,900 to $795,000. That was a modest monthly decline rather than a broad market collapse.
What mortgage rate applied during the September 2026 report?
Freddie Mac reported the national average 30-year fixed-rate mortgage at 6.71% as of September 3, 2026.
Was Kootenai County a buyer’s market or seller’s market?
The answer depended on price range, property type and location. Buyers had more choices than earlier in the year, while well-priced homes in desirable segments could still favor sellers.
Why did different housing market sources show different numbers?
Different sources can use different geography, property types, listing statuses, reporting periods and calculation methods. Realtor.com/FRED public inventory data is not the same as a local MLS closed-sales report.
Can this archived market update determine my home’s value today?
No. This report provides historical market context. Current home value should be evaluated using today’s comparable sales, active competition, property condition, location and buyer demand.
Where can I find the latest Kootenai County market data?
Visit the Current Kootenai County Real Estate Market Conditions page for the newest report.


