

 Facebook
 X
 Pinterest
 Copy Link
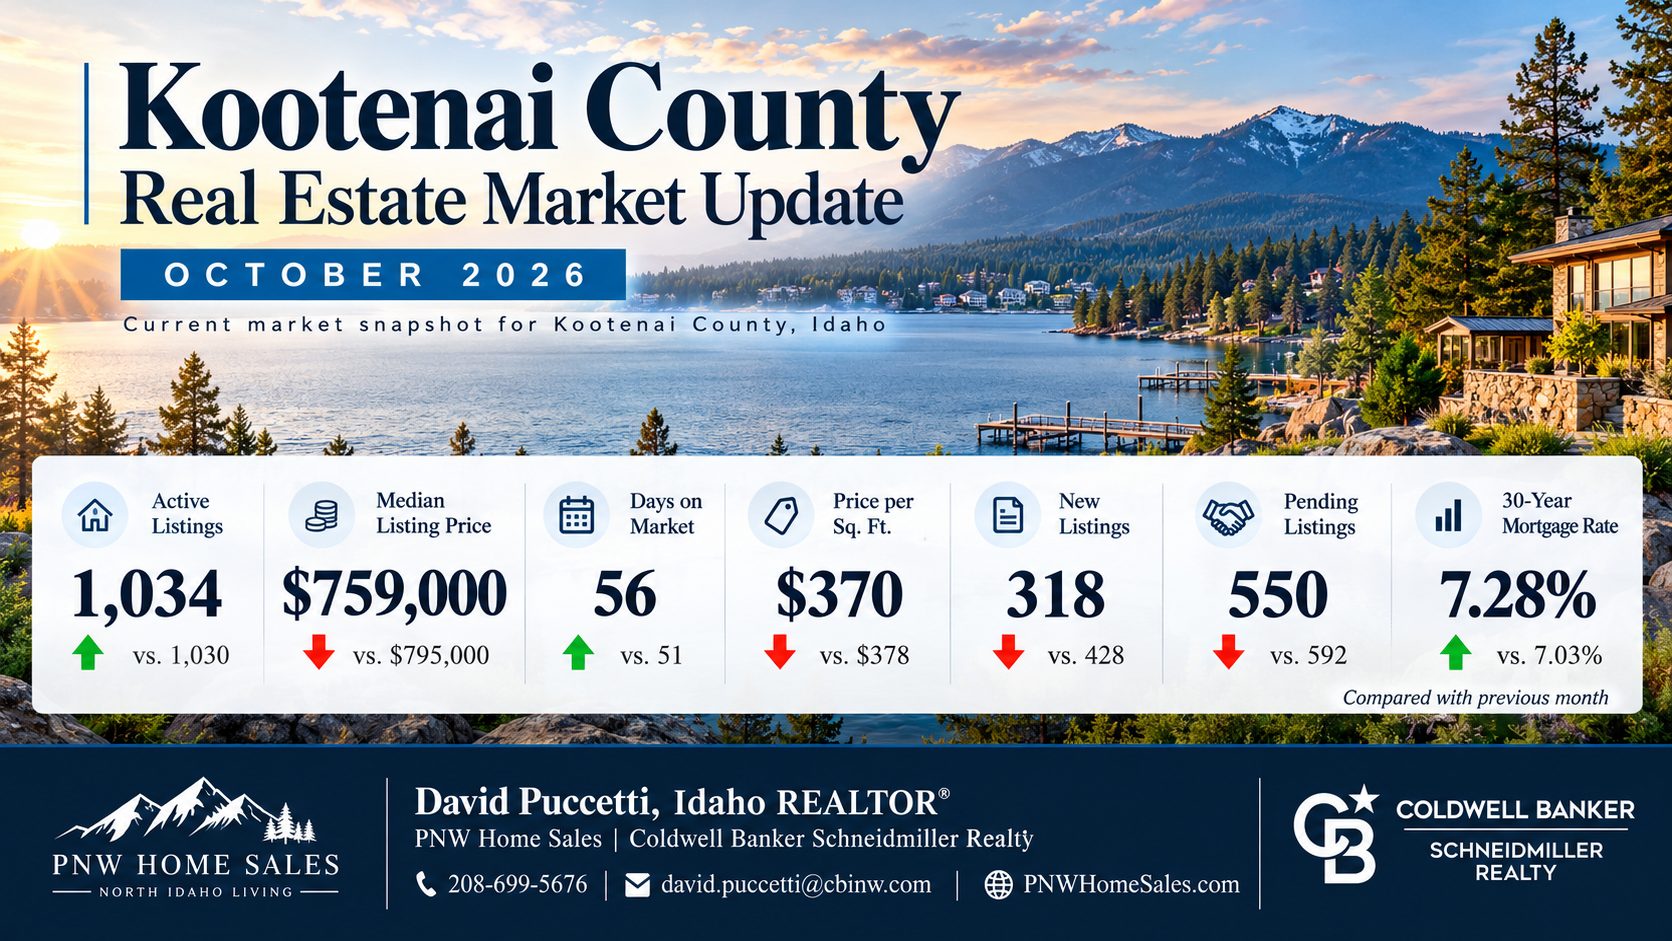
October 2026 Market Archive | Originally published October 6, 2026
Kootenai County Real Estate Market — October 2026 Archive
This page preserves the October 2026 Kootenai County real estate market update as a historical reference. The report was originally published on October 6, 2026 and primarily reflects September 2026 housing inventory and listing data, which was the newest complete county-level data available when the October report was prepared.
The report also includes mortgage-rate information available at the beginning of October 2026.
Because this is an archived market update, the statistics below should not be interpreted as current Kootenai County market conditions.
For the newest housing data, inventory, pricing trends, mortgage-rate context and buyer/seller analysis, visit the live market page:
View the Current Kootenai County Market Update
October 2026 Kootenai County Market Snapshot
When this report was published, the Kootenai County housing market was moving from summer into fall with inventory essentially unchanged from August, lower asking-price metrics, slower pending activity and longer marketing times.
The major October 2026 market indicators were:
- 1,034 active listings
- 1,580 total listings
- $759,000 median listing price
- $370 median listing price per square foot
- 56 median days on market
- 318 new listings
- 550 pending listings
- 374 price-reduced listings
- 7.28% national average 30-year fixed mortgage rate as of October 1, 2026
Historical takeaway: inventory had stopped expanding rapidly, but buyers were becoming more selective as mortgage rates increased and homes spent more time on the market.
October 2026 Market Archive: Quick Navigation
Kootenai County Housing Data — October 2026 Archive
The newest complete public county-level housing data available when the October report was prepared covered September 2026.
That distinction matters. This is the October 2026 market update, but most of the housing statistics represent September activity because complete monthly datasets are generally released after the month ends.
Scroll → to review the October 2026 market snapshot
Archive note: Realtor.com/FRED data uses listing-based county statistics. Local MLS statistics may use different geography, property types, statuses and reporting methodology.
Inventory and Listing Trends Heading Into October 2026
One of the clearest October signals was what did not happen: Kootenai County did not experience another large inventory increase after the summer build.
Active inventory changed only from 1,030 listings in August to 1,034 in September.
At the same time:
- total listings declined from 1,596 to 1,580
- new listings fell from 428 to 318
- pending listings fell from 592 to 550
- median days on market rose from 51 to 56 days
This indicated a market beginning its normal seasonal transition while buyers were becoming more selective.
May Through September 2026 Market Progression
Scroll → to review the 2026 inventory progression
The spring and summer inventory build had effectively leveled off by September, while marketing time continued to increase heading into October.
Kootenai County Home Prices in the October 2026 Market
The countywide Realtor.com/FRED median listing price declined from $795,000 in August to $759,000 in September 2026.
That was also below the $780,238 median asking price recorded during September 2025.
However, this did not mean every Kootenai County property had declined in value.
Why Median Listing Prices Can Move
The median can shift because of changes in the type of properties currently listed.
Those differences can include:
- luxury homes
- waterfront properties
- acreage
- new construction
- condominiums
- townhomes
- lower-priced residential inventory
- seller price reductions
A month with more luxury or waterfront inventory can push the median higher even if individual home values remain stable.
A month with more entry-level or attached housing can move the median lower.
Historical countywide asking-price data should therefore be used as market context rather than as a valuation formula for a specific home.
Mortgage Rates in Early October 2026
Mortgage rates were one of the most significant affordability issues affecting the market when this October report was published.
Freddie Mac reported:
- 30-year fixed mortgage: 7.28% on October 1, 2026
- 15-year fixed mortgage: 6.60%
The 30-year benchmark had increased from 7.03% one week earlier and was above the approximately 6.34% national average from one year earlier.
This created an important October 2026 dynamic:
asking prices had softened while financing costs had increased.
A lower negotiated purchase price therefore did not necessarily create a lower monthly payment.
What Buyers Needed to Compare
- principal and interest
- property taxes
- homeowners insurance
- mortgage insurance when applicable
- HOA dues
- utilities
- maintenance
- cash needed to close
For current financing information, review Comparing Home Loans in North Idaho.
Coeur d’Alene, Post Falls, Hayden and Rathdrum — October 2026 Market Context
Countywide statistics were useful for identifying broader trends, but Coeur d’Alene, Post Falls, Hayden and Rathdrum did not function as one identical housing market.
Property type, location, price range and new-construction competition could create very different conditions.
Scroll → for October 2026 community context
What the October 2026 Market Meant for Buyers
October 2026 produced competing forces for buyers.
Potential advantages included:
- lower asking-price metrics
- longer market times
- continued price reductions
- slower pending activity
- less seasonal competition for some properties
The major disadvantage was financing.
Mortgage rates above 7% placed additional pressure on monthly payments, making it important for buyers to evaluate total cost rather than purchase price alone.
Where Buyers Could Have Found More Negotiating Leverage
- homes with extended days on market
- previously reduced listings
- properties needing repairs or updating
- homes facing substantial comparable competition
- resale properties competing with new construction
- properties with higher recurring ownership costs
Correctly priced homes in desirable locations could still attract meaningful buyer interest.
The October 2026 market was therefore not a situation where buyers could assume every seller would accept a large discount.
What the October 2026 Market Meant for Sellers
The October market increasingly rewarded accurate initial pricing.
At the time:
- median days on market had increased
- pending activity had slowed
- price reductions remained common
- mortgage rates had moved higher
That made it more difficult for an overpriced listing to rely on limited inventory alone.
October 2026 Seller Priorities
- use relevant recent closed sales
- review current active competition
- compare pending sales when available
- identify competing price reductions
- compare resale homes with builder inventory
- complete obvious repairs
- prepare the home carefully before listing
- use professional photography
- monitor showing activity during the first weeks
- respond to repeated buyer feedback
In a market with longer marketing times, the first several weeks of a listing could provide important information about whether buyers viewed the price as competitive.
Was Kootenai County a Buyer’s Market in October 2026?
A single countywide label does not fully describe Kootenai County.
Market conditions varied by:
- community
- price range
- property type
- condition
- lot size
- waterfront status
- acreage
- new construction
A longer-market-time property with repeated reductions could provide substantial negotiating room.
A correctly priced home in strong condition could still sell quickly.
Luxury, waterfront and acreage properties could also behave differently from conventional subdivision homes.
The more useful October question was therefore not simply whether the county favored buyers or sellers.
It was:
How competitive was the specific property segment?
Looking for the Current Kootenai County Market?
This October 2026 report is a historical archive. Housing inventory, mortgage rates, prices and buyer demand have changed since this snapshot was published.
Use the current market page for the newest available Kootenai County data and analysis.
View the Current Market Update
If you need property-specific information or want to compare current conditions in Coeur d’Alene, Post Falls, Hayden or Rathdrum:
David Puccetti, Idaho REALTOR®
PNW Home Sales | Coldwell Banker Schneidmiller Realty
Call or text: 208-699-5676
Email: david.puccetti@cbinw.com
Website: PNWHomeSales.com
October 2026 Market Data Sources & Methodology
This historical market report used public county housing inventory data, local MLS market information and national mortgage-rate information available when the October 2026 report was prepared.
- Coeur d’Alene Regional REALTORS® Market Data
- FRED / Realtor.com — Kootenai County Active Listings
- FRED / Realtor.com — Total Listings
- FRED / Realtor.com — Median Listing Price
- FRED / Realtor.com — Median Days on Market
- FRED / Realtor.com — Median Listing Price Per Square Foot
- FRED / Realtor.com — New Listings
- Freddie Mac Primary Mortgage Market Survey
Historical-data note: housing datasets can be revised after initial publication. Data providers also use different property types, geographic boundaries, listing statuses and calculation methods. This page preserves the market picture available in early October 2026 and should not be substituted for current housing data, an appraisal, financial advice or a prediction of future market performance.
October 2026 Kootenai County Market: Historical Takeaway
The October 2026 market represented a transition from the active summer season into a more selective fall market.
Inventory had largely stopped increasing. Active listings were almost unchanged from August and remained slightly below the prior year’s level.
At the same time:
- asking-price metrics moved lower
- marketing times increased
- new listings slowed
- pending activity declined
- mortgage rates moved above 7%
For buyers, that created additional negotiating opportunities on some properties but also substantially higher financing costs.
For sellers, the market increased the importance of accurate pricing, condition, presentation and competitive positioning.
Most importantly, the October 2026 data reinforced that Kootenai County was not one uniform housing market.
Coeur d’Alene, Post Falls, Hayden, Rathdrum, new construction, waterfront, acreage, luxury homes and lower-price properties could all behave differently from countywide averages.
This page should now be treated as a historical October 2026 benchmark. For current conditions, use the live Kootenai County market update.
Frequently Asked Questions About the October 2026 Kootenai County Real Estate Market
Is this the current Kootenai County real estate market report?
No. This page is the archived October 2026 Kootenai County real estate market report. Visit the current Kootenai County market update for the newest housing data.
What data period does the October 2026 market report use?
Most of the county housing statistics in the October 2026 report reflect September 2026 activity because September was the newest complete monthly dataset available when the report was prepared in early October.
How many active listings were there in the October 2026 report?
The report used September 2026 Realtor.com/FRED data showing 1,034 active Kootenai County listings.
What was the median listing price?
The September 2026 median listing price used in the October report was $759,000, compared with $795,000 in August 2026 and $780,238 in September 2025.
How long were homes staying on the market?
The September 2026 public median was 56 days on market, compared with 51 days in August and 65 days one year earlier.
Was Kootenai County inventory still increasing?
Not materially during the latest period covered by the October archive. Active listings increased only from 1,030 in August to 1,034 in September.
Were fewer homes entering the market?
Yes. New listings declined from 428 in August to 318 during September 2026.
Were pending listings slowing?
Yes. Pending listings declined from 592 in August to 550 in September and were below the 611 reported in September 2025.
Were sellers reducing prices?
Realtor.com/FRED recorded 374 price-reduced listings in September 2026, compared with 424 in August and 336 in September 2025.
What was the mortgage rate in early October 2026?
Freddie Mac reported a national average 30-year fixed mortgage rate of 7.28% on October 1, 2026 and a 15-year fixed average of 6.60%.
Was October 2026 a buyer’s market or seller’s market?
Conditions varied substantially by property type, location and price range. Buyers had greater leverage on some longer-market-time or overpriced properties, while well-positioned homes could still receive strong interest.
Did falling median listing prices mean every Kootenai County home lost value?
No. Countywide median listing prices are affected by the mix of properties on the market. Luxury homes, waterfront properties, acreage, new construction, condos and lower-priced homes can all shift the countywide median.
Can this archived report tell me what a home is worth today?
No. This archive preserves historical countywide market conditions. Current property value depends on current comparable sales, active competition, condition, location, property type and buyer demand.
Where can I find the current Kootenai County housing market?
The current Kootenai County market report is available at Kootenai County Real Estate Market Conditions.


